Clustering is a method to divide data points into a number of groups which the data in this group should have more similarity than others.
For example: if we know the petal length and sepal length of some flowers, we can divide these flowers into several group.
k-means
- Specify the number of clusters k
- Randomly assign each data to a cluster
- Computer the centroids for each cluster
- Re-assign the points to the closest centroids
- Re-compute the centroids for each cluster
- Repeat 4 and 5 until no improvements
![123}(https://image.jiqizhixin.com/uploads/editor/7958a474-21ec-4e94-a7a1-c53b63556d97/640.gif)]
Advantage:
- For large amount dataset, it can be converge very fast
Disadvantage:
- Hard to predict the value
- It can not work well for different density or size cluster
- It depends on the initial centroids, different initialization may results the different cluster outcomes
How to set value?
There is a popular method known as elbow method which is used to determine the optimal value of K to perform the K-Means Clustering Algorithm. The basic idea behind this method is that it plots the various values of cost with changing k. As the value of K increases, there will be fewer elements in the cluster. So average distortion will decrease. The lesser number of elements means closer to the centroid. So, the point where this distortion declines the most is the elbow point.
For example:
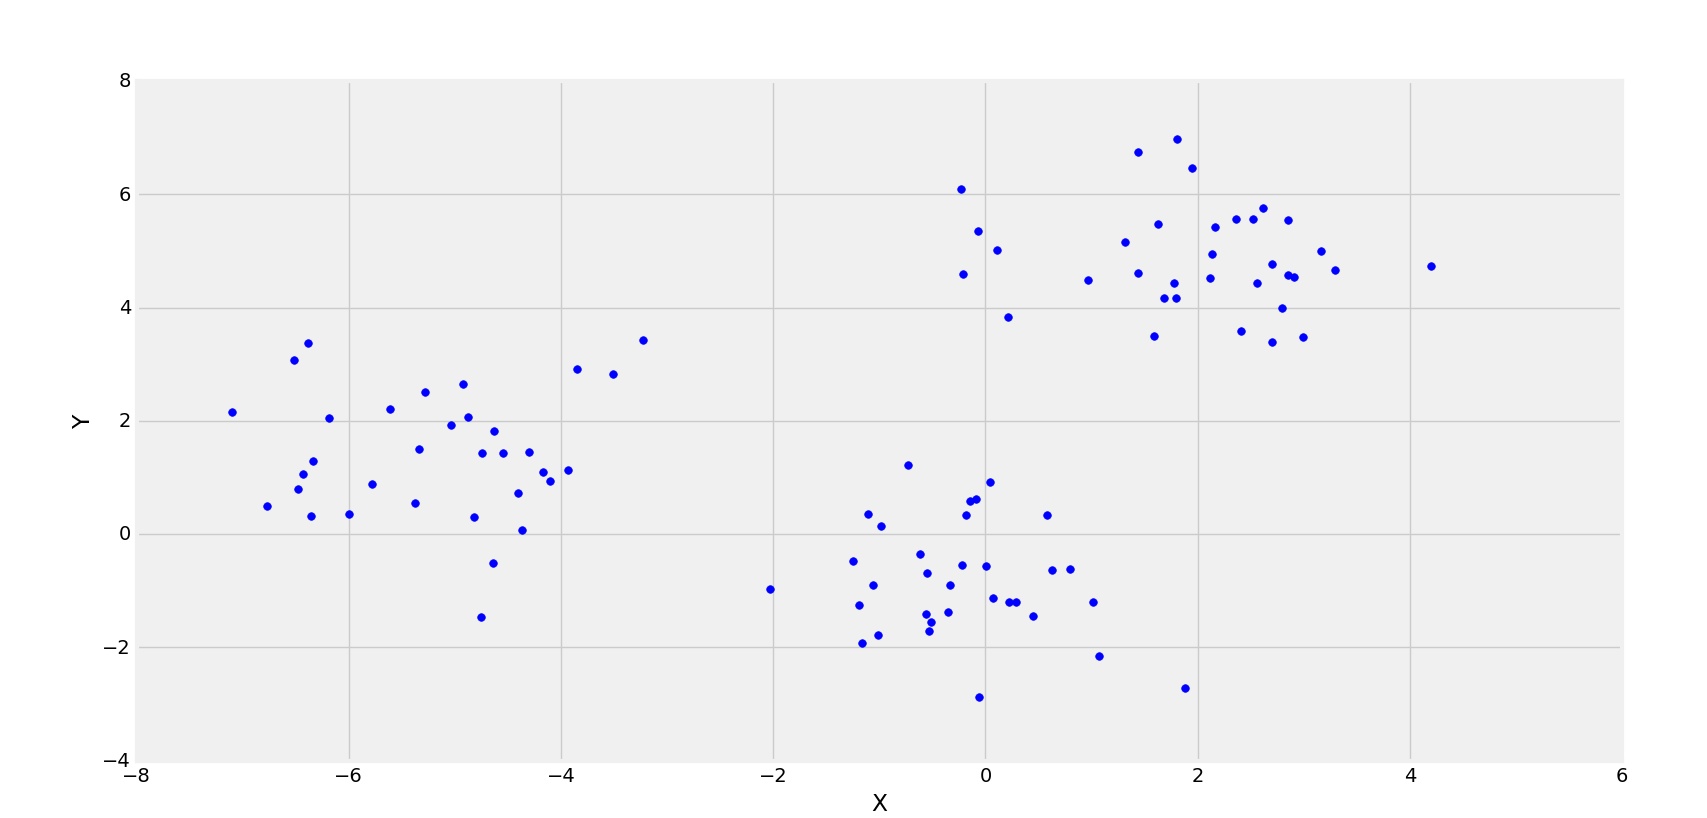
In the above figure, its clearly observed that the distribution of points are forming 3 clusters. Now, let’s see the plot for the squared error(Cost) for different values of K.
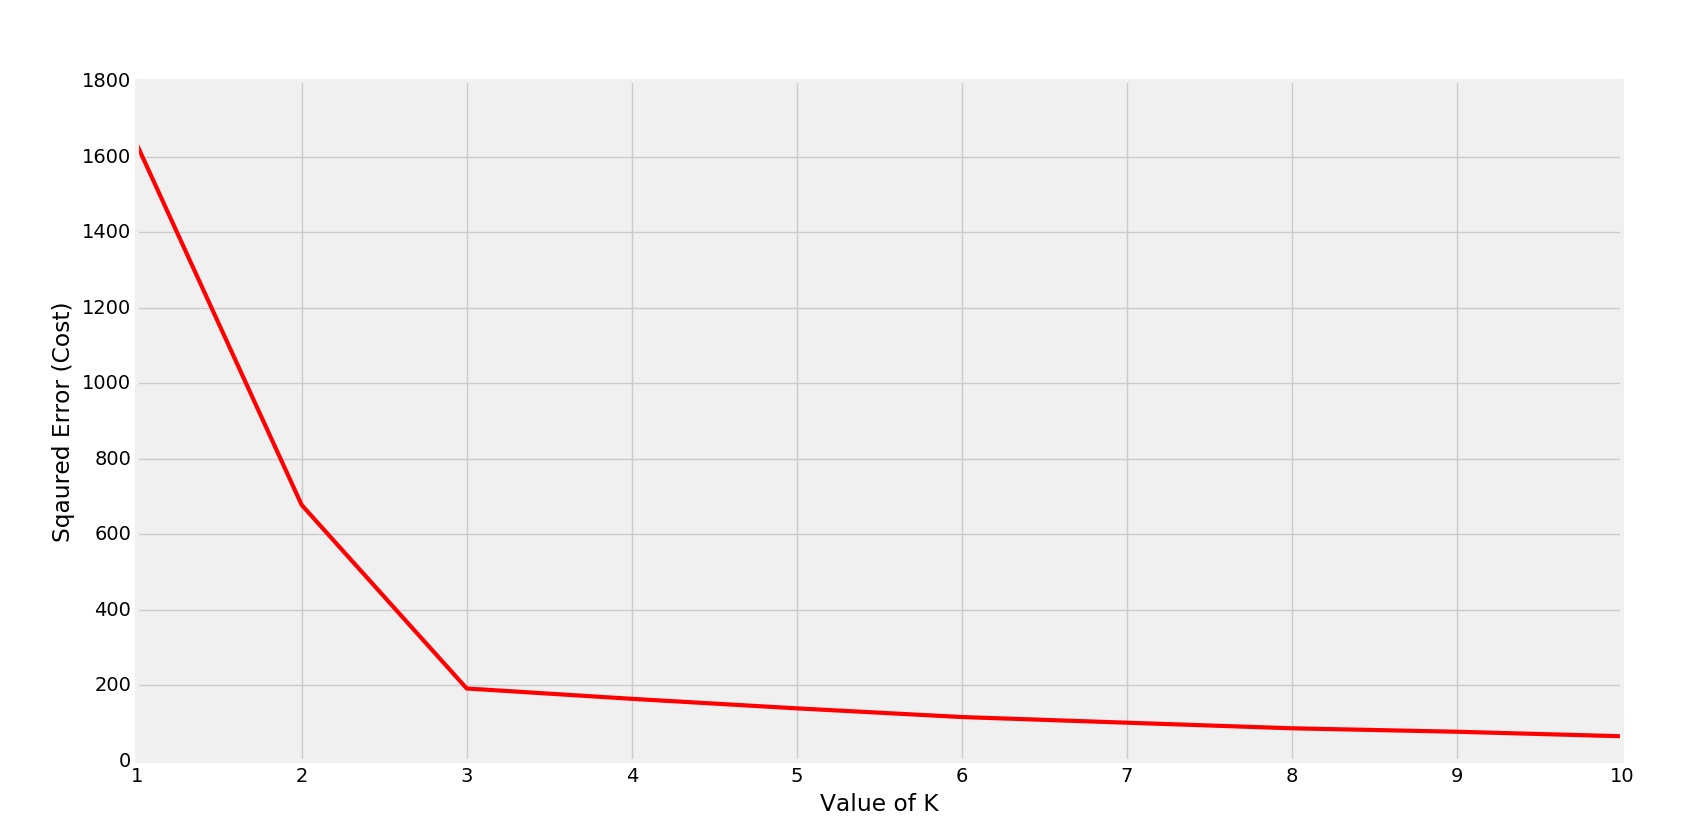
Elbow is forming at K=3
Clearly the elbow is forming at K=3. So the optimal value will be 3 for performing K-Means.
Hierarchical Clustering
This can be divided into 2 types: Top-down and Bottom-up
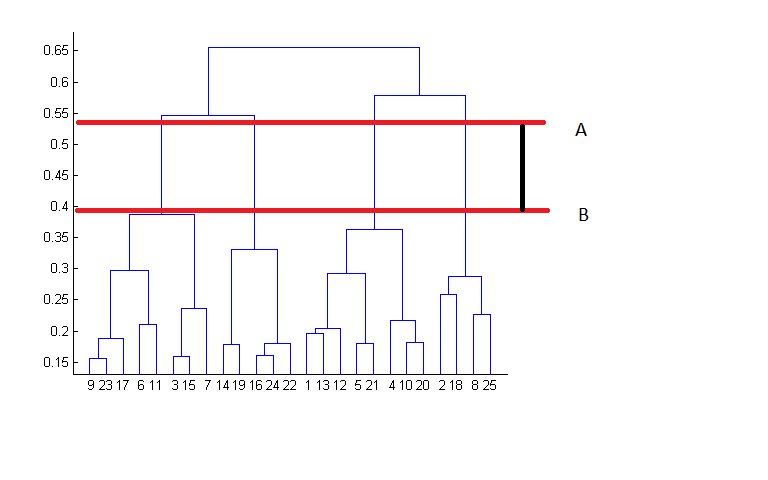
For Bottom-up:
- From bottom, assign each data as a cluster
- Two closest cluster are merged into one cluster (calculate the distance)
- The best choice of the number of clusters is to find number of vertical line at maximum distance between the mergence . (Here is the number of blue line between A to B)
Comparison
-
Hierarchical Clustering can not handle the big data but k-means can. k-means has and HC has
-
k-mean is good when cluster has shape circle in 2D, sphere in 3D.
Dbscan (Density Based Spatial Clustering of Applications with Noise)
Dbscan is a density based clustering algorithm, it is focused on finding neighbors by density (MinPts) on an ‘n-dimensional sphere’ with radius ɛ. A cluster can be defined as the maximal set of ‘density connected points’ in the feature space.