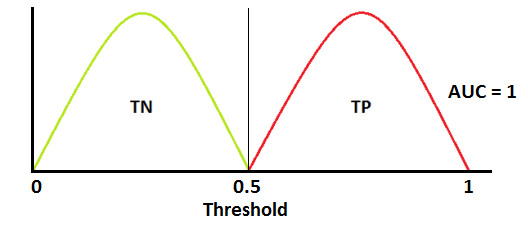
Higher the AUC(Area Under The Curve), better the model is at predicting True postive. AUC represents degree or measure of separability
The process to draw the ROC(Receiver Operating Characteristic curve) is: We select Threshold from 1 to 0, caculate the TPR and FRP to draw ROC.
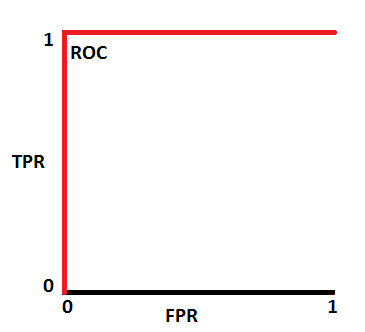

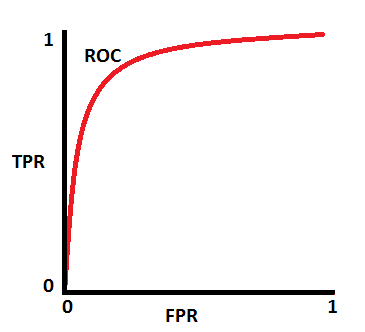
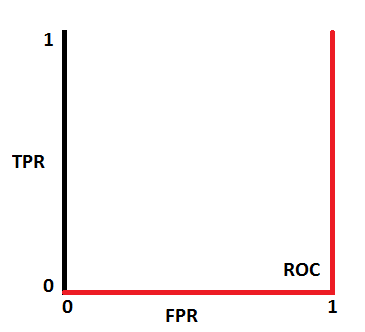
The closer an ROC curve is to the upper left corner, the more efficient is the test.
Test A is better than Test B.
In multi-class model, we can plot N number of AUC ROC Curves for N number classes using One vs ALL methodology. So for Example, If you have three classes named X, Y and Z, you will have one ROC for X classified against Y and Z, another ROC for Y classified against X and Z, and a third one of Z classified against Y and X.